cecelyfranz

Identifying Carbohydrates

This is a link to the questions we answered about this lab.

https://docs.google.com/document/d/1sgUQq7NYPrTE5-e0B6Cqd-yaD6veSXjOYCCuj7o85vc/edit?usp=sharing

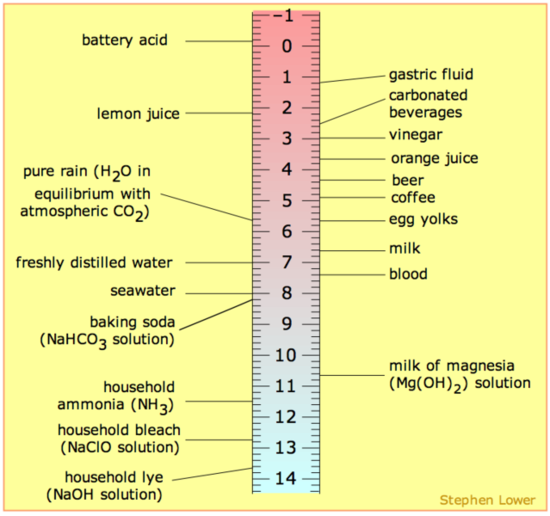
Carbohydrates are macromolecules. They are made up of carbon, hydrogen, and oxygen. There are three different types of carbohydrates. Monosaccharides are the building blocks and are just one molecule. Disaccharides are two monosaccharides linked together. Polysaccharides are chains of multiple monosaccharides linked together.

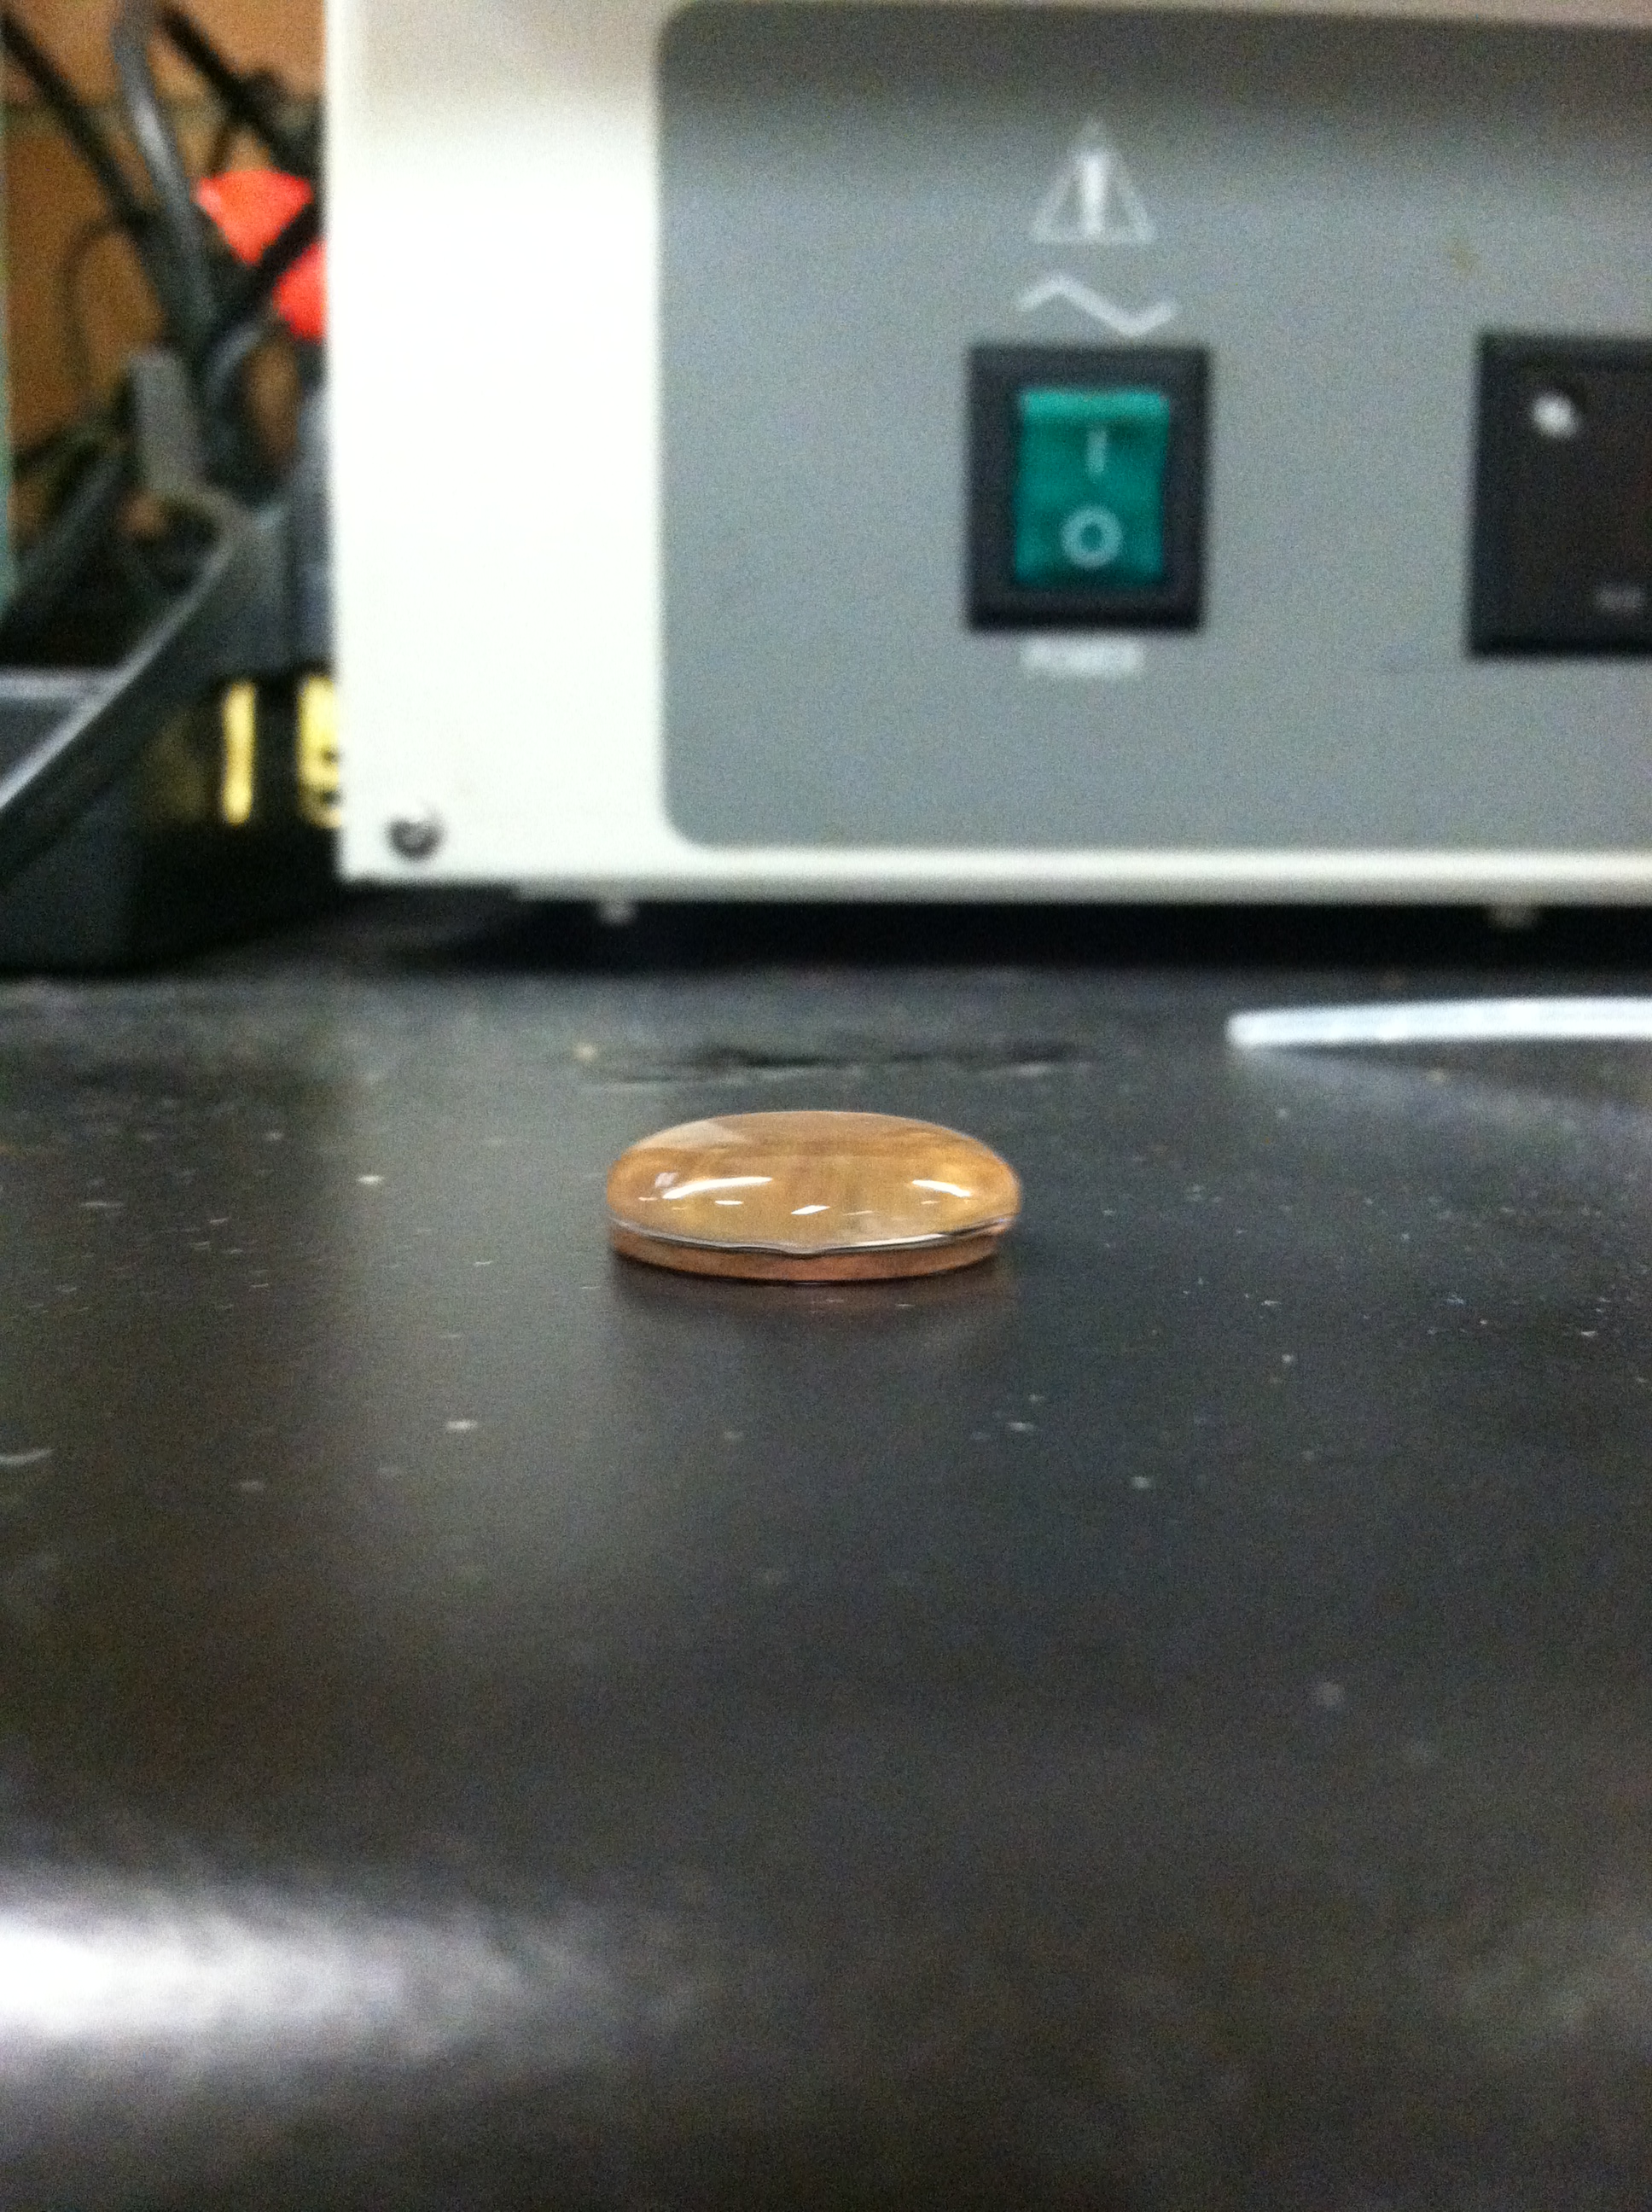
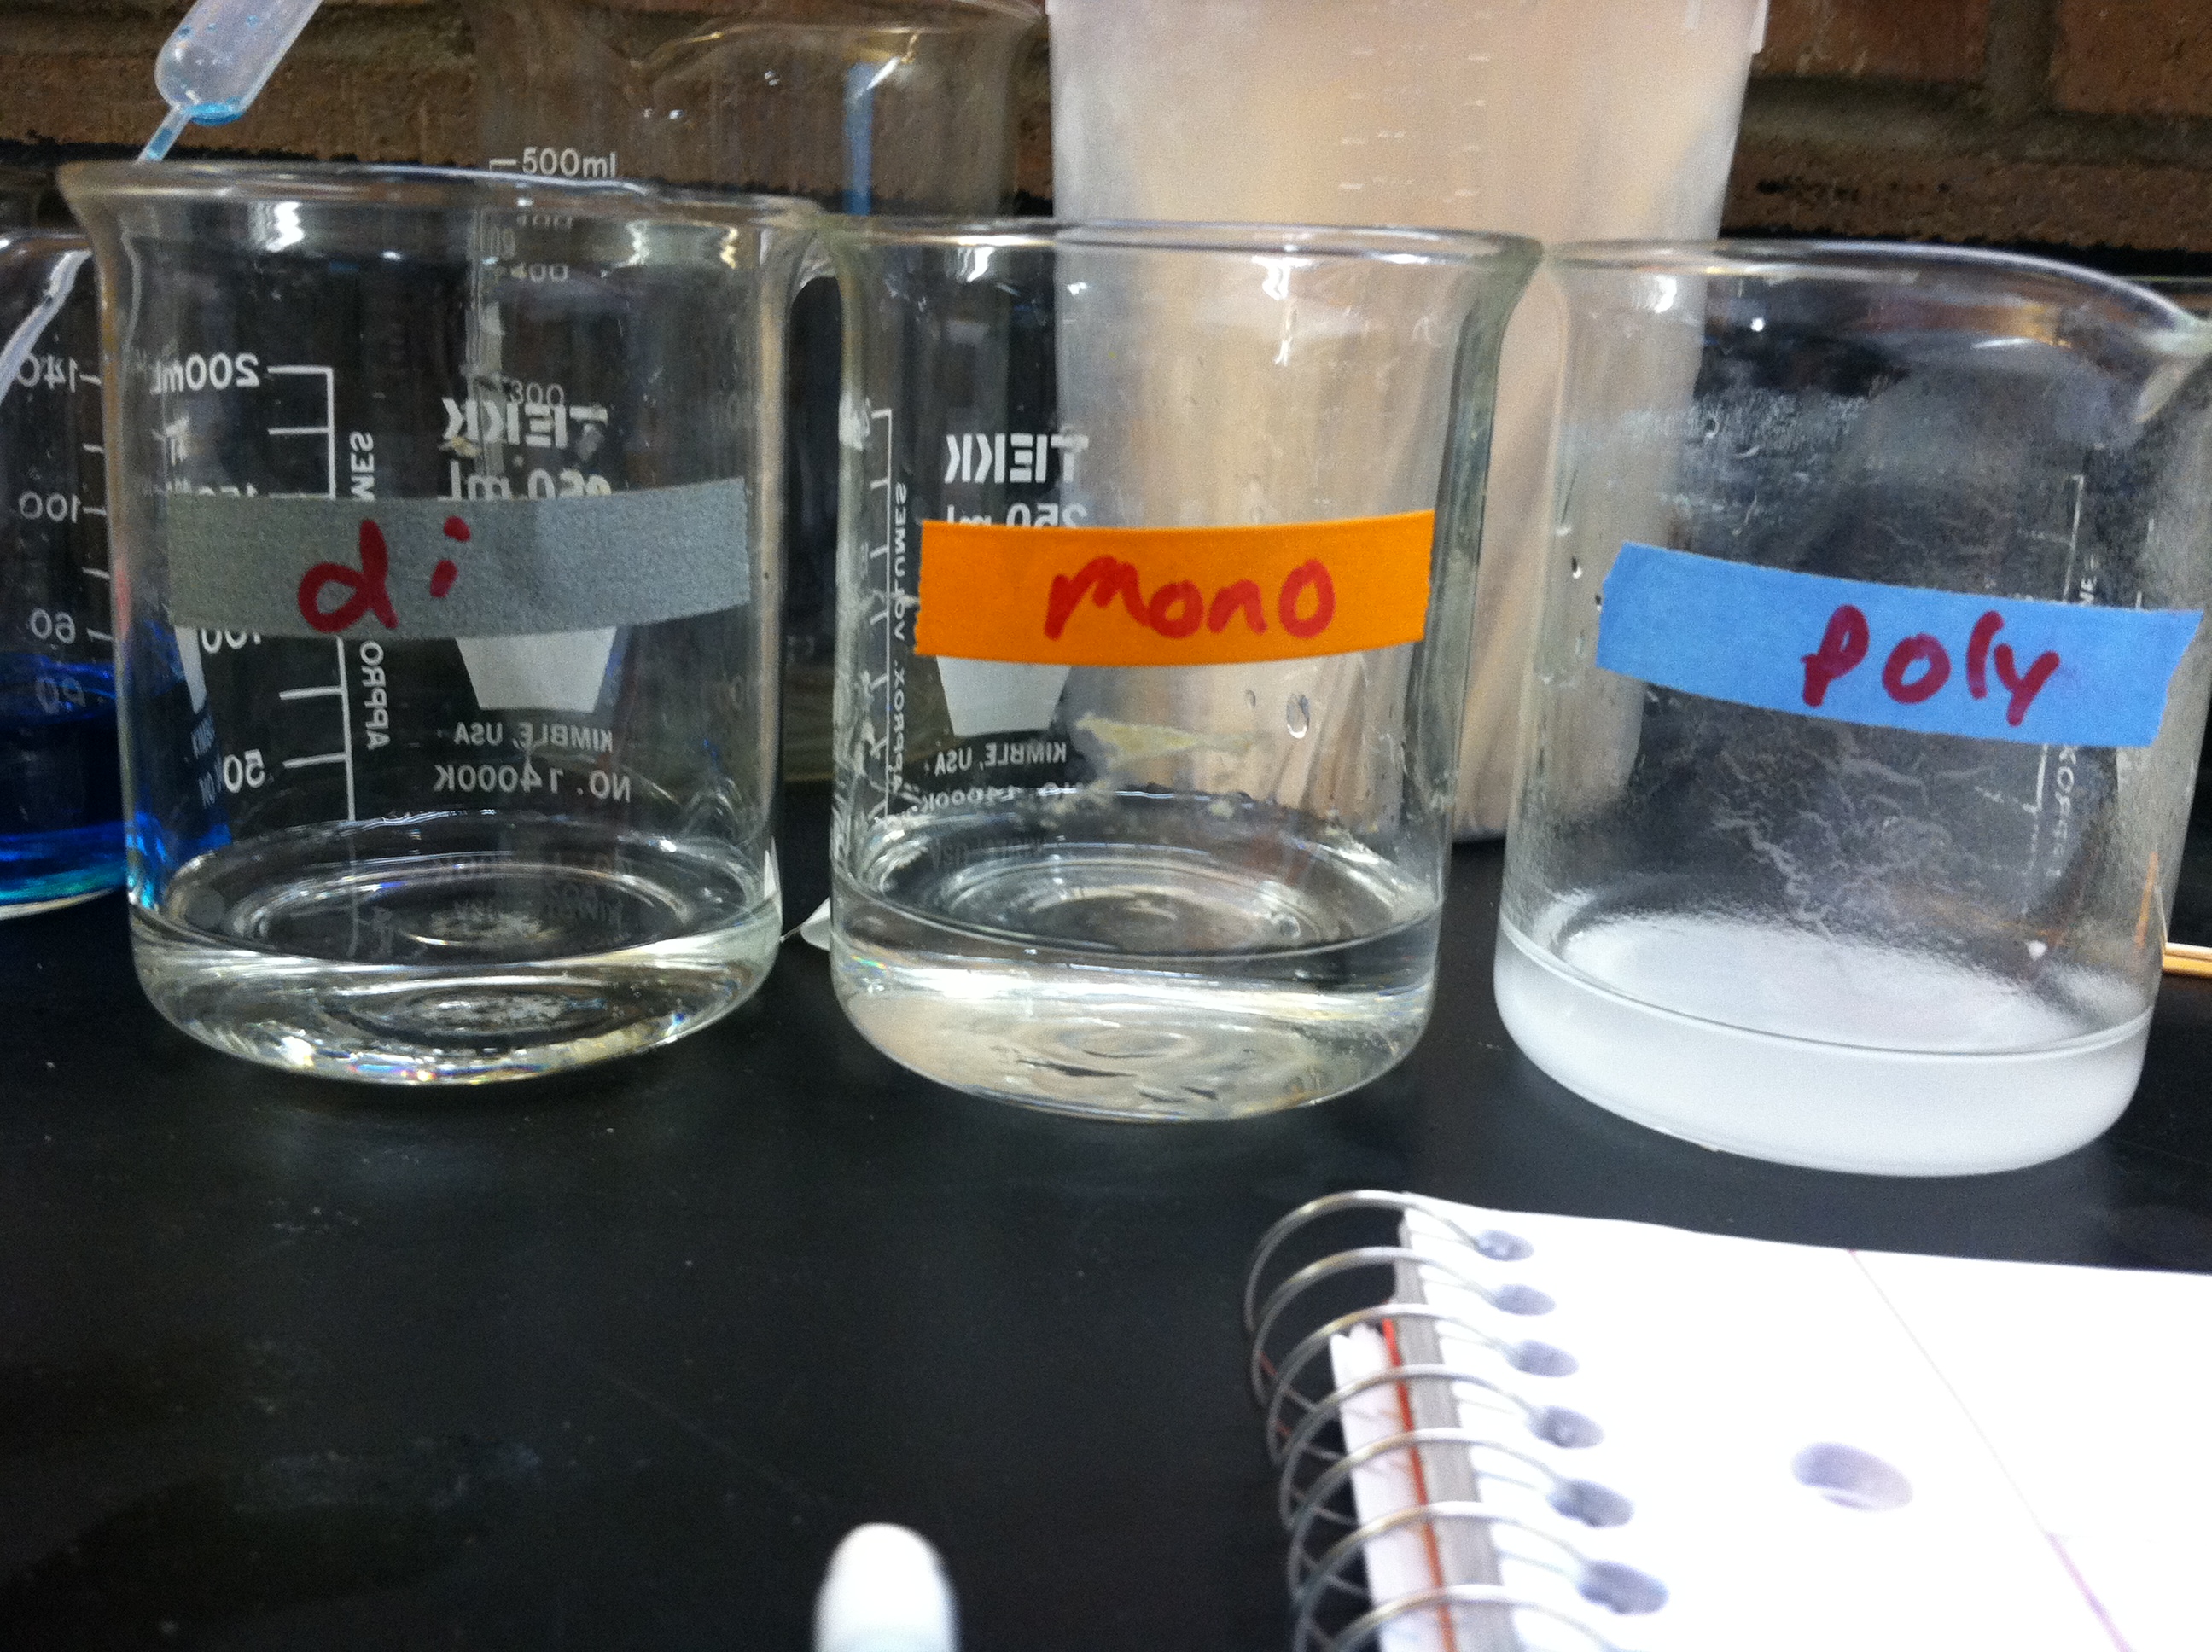
We have been working on a lab about how to identify different carbohydrates. We wanted to be able to determine whether a substance is a monosaccharide, a disaccharide, or a polysaccharide. The materials that were needed were beakers, pipettes, test tubes, Benedict’s solution, iodine, a way to heat the solutions, a monosaccharide, disaccharide, and a polysaccharide. We began by testing how a monosaccharide, disaccharide, and polysaccharide change when they are mixed with Benedict’s solution. We poured each of the saccharides into their own test tubes. We then put a reasonable amount of drops of the Benedict’s solution into each of the test tubes. Next, we heated them up for five minutes. After they were heated, we could see the change in the monosaccharide. The monosaccharide changed to an orange color. The disaccharide and the polysaccharides did not have a color change when mixed with the Benedict’s solution. The next thing we did was to test how these three saccharides change when they are mixed with iodine. Like before, we poured each of the saccharides into their own test tubes. Next, we added a reasonable amount of drops of iodine to each of the test tubes. We didn’t need to heat these mixtures. They monosaccharide and disaccharide had no change when mixed with the iodine. There was a big change in the color of the polysaccharide. When the iodine and polysaccharide were mixed, the mixture turned a dark black color.

photo 2  photo  photo 1

The next part of the lab was to test different types of substances to see whether they were a monosaccharide, disaccharide, or polysaccharide. The five substances we decided to test were sugar, malt sugar (maltose), cornstarch, milk sugar, and graham crackers which we crushed into small pieces. We began by placing each of these five substances into their own beaker. We then added water into each of these five beakers so that these substances could dissolve in the water. After that, we poured each of the substances from their beakers into their own test tubes. We labeled of the test tubes so we would remember which substance they were. Next, we added drops of Benedict’s solution to each of the test tubes and heated them for five minutes. When we took them from the heat, we could see a color change to orange in the malt sugar and the milk sugar. From this, we could tell that malt sugar and milk sugar have the presence of glucose. You would think that these were monosaccharides because of the color change, but they are actually disaccharides. The other mixtures were just a blue color. The next step was to wash the test tubes and pour the five substances that were mixed with water into their own test tubes again. We then put drops of iodine into each of the test tubes. We could see a color change to a dark black color in the graham crackers and the cornstarch. This color change showed that the cornstarch and graham crackers are polysaccharides. The other mixtures were just the color of the iodine.


Table 3

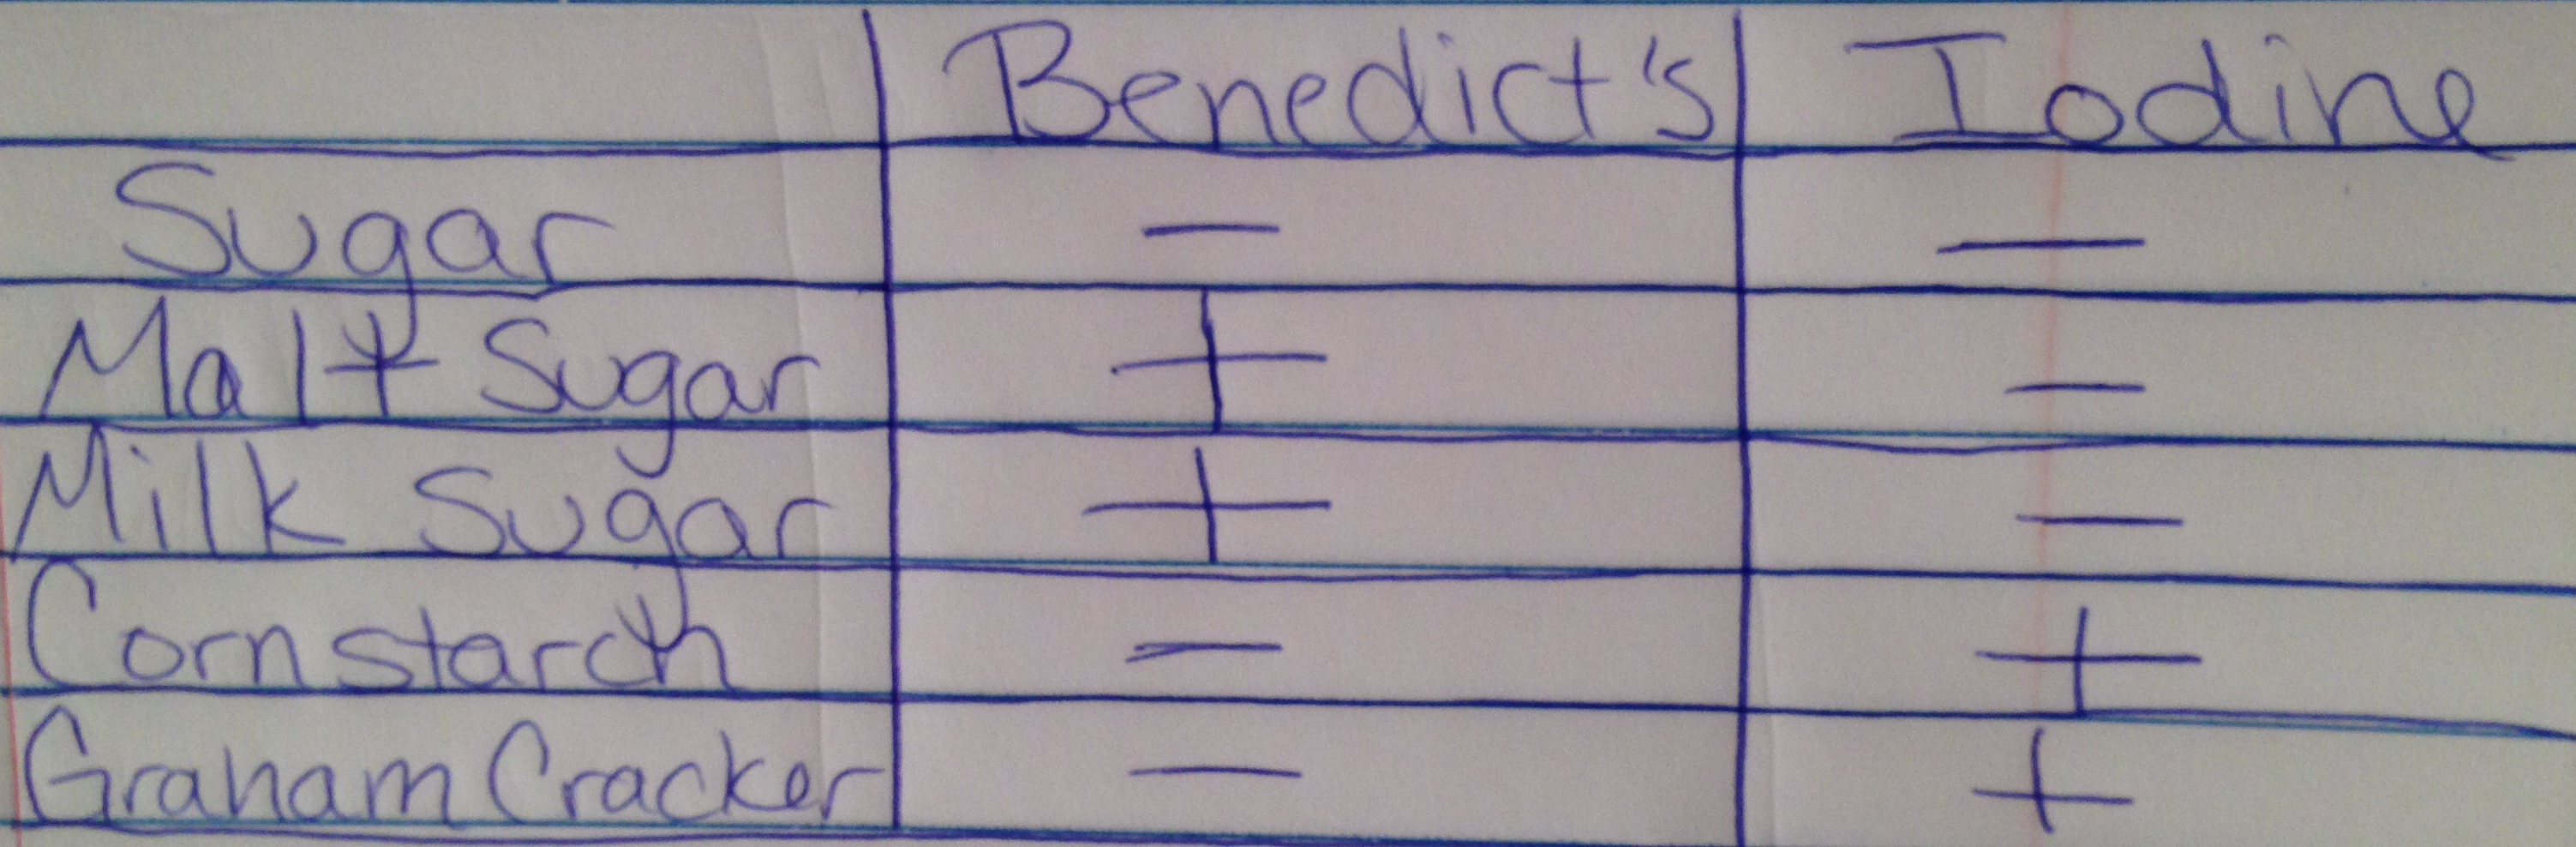
From these results, we can see that things such as graham crackers and cornstarch are polysaccharides. We would think that malt sugar and milk sugar are monosaccharides, but since they are essentially maltose and lactose, they are actually disaccharides. They showed a color change in the Benedict’s test because they have the presence of glucose. Sugar is a disaccharide and it had no change in either of the tests.

Leave a comment »

Macromolecules

https://docs.google.com/document/d/1izFhV1AMN1Z5ghZEdMhS3rx2hVLmwwEft4flc6qSzxc/edit?usp=sharing

Here is a link to an activity we did in class this week. We visited the website that is in the document and researched the website to answer the questions. This activity was over macromolecules.

Leave a comment »

Acids in our Stomach Lab

We did another lab this week dealing with the acids in our stomach. The purpose of this experiment was to see how well antacids neutralize the acids in our stomach. In our experiment, we decided to see if the generic brands of antacids work as well as the name brands that we pay more money for. I hypothesized that the generic brands would work just as well as the name brands.

The pH scale measures how basic or acidic a substance is. A substance that has a pH level that is less than 7 is defined as an acid. If the pH level is greater than 7, than the substance is identified as basic or alkaline. A substance with a pH level of 7 is considered neutral. An example of a substance with a pH level of 7 would be pure water. You can test the pH level of a substance by using special pH level testing strips that change color to indicate the level.

639px-PH_scale

We began by measuring 25 milliliters of vinegar in a graduated cylinder. We then poured the vinegar into a cup and repeated this three more times so that we would have four cups of vinegar. We used the vinegar to act as the acids in our stomach. We then used a pH testing strip to test the pH of the vinegar, which had a pH of 3. The next step was to test the antacids in the vinegar. We ground up two tablets of regular strength, peppermint Tums with a mortar and pestle until it was completely crushed. Then we poured the crushed up tablets into one of the cups of vinegar. The mixture rapidly bubbled up and the tablets completely dissolved. When we tested the pH level of this mixture with a pH level testing strip, it was at a 6. We then repeated these steps with two tablets of regular strength, peppermint Safeway brand antacids. When we poured these ground up tablets into the vinegar, they didn’t want to mix in or dissolve. After we stirred it for a few minutes, the powder still sat on top of the vinegar. We tested this mixture and it had a pH level of 5. We repeated the steps for one final time with two tablets of regular strength, peppermint Equate antacids. The powder sat on top, but after we stirred it, it mixed in a little bit and foamed up. The pH level of this mix was a 5.

The results of this experiment show that all of the brands did neutralize the vinegar. However, the name brand antacid, Tums, did have a higher pH level than the generic Safeway and Equate brands. This means that the name brand neutralized the vinegar better than the generic brands. So my hypothesis was not exactly correct. I thought that all three brands would work the same, but the name brand did work a little better than the generic brands.  I guess in this case, the name brand is worth spending the extra money because it really does work better than the generic brands.

graph

Leave a comment »

Properties of Water and Lab

Earlier this week, our class did three experiments to test the properties of water. Some of the properties of water displayed in these experiments were cohesion, adhesion, and surface tension. Adhesion is when water sticks to another substance. Cohesion is when water sticks to water, and it goes along with surface tension, which is defined as the “tendency of water molecules to attract one another”. Surface tension and cohesion are what cause the “skin” like covering that makes it possible for water to build the dome shape that it has when you pour a glass of water a little bit above the rim. In all three of these properties water tends to be “sticky”. It either sticks to itself or to another substance. This quality of water is present in all of these experiments.

In the first experiment that we did, we were testing how many drops of water we could place on a penny before it would spill over. We also tested how many drops of alcohol could be placed on the penny. I hypothesized that the penny would hold more drops of water than it would alcohol. So I began by testing the water on the penny. I took a pipette and filled it with the water, then slowly began to drop the water on the penny, one drop at a time. I was able to get fifty drops of water on the penny before it spilled off. Next, I filled the pipette with alcohol and began placing the drops on the penny. This time, I was only able to place thirty drops on the penny before it spilled over. My hypothesis was correct, the penny held more drops of water than of alcohol. The reason that the penny could hold more water is because of waters properties of cohesion and surface tension. The hydrogen bonds in water make the molecules stick together, so all of the drops of water began sticking to each other. The alcohol doesn’t have the same hydrogen bonds, so it doesn’t build up like the water does. The water began to form a large dome shape due to surface tension. I could continue to place drops of water on the penny because it would just keep sticking together and building the dome until it spilled over the raised edge of the penny. The properties of cohesion and surface tension have importance to living organisms. For example, trees are able to get water from the roots all the way up to the leaves because of these properties. Trees have tons of tiny tubules that run from the roots to the top. The water sticks to the sides of these tubes because of cohesion and as more water comes into the roots, the water creeps up the tubes all the way to the leaves. So in conclusion, my results proved my hypothesis to be correct, and through this experiment, I learned about how surface tension works.

Surface Tension

In the second experiment, we tested the behavior of a drop of water on a piece of wax paper. We were trying to see what would happen to the water when we tried to cut it in half with a toothpick. I hypothesized that when I tried to cut water in half, it would separate the drop and make two separate drops. So I then began the experiment by gathering the needed tools which were a piece of wax paper, a pipette, a toothpick, and water. Using the pipette, I placed a drop of water on the sheet of wax paper. The water formed a circular dome, almost the shape of a sphere, but it was flattened on the bottom and top. Then, using the toothpick I tried to slice the drop in half, but it wouldn’t cut. Instead, the drop either moved around the toothpick, or drag along with the pick. This experiment also displayed the property of cohesion. The water sticks to itself on the wax paper instead of spreading out. If I were to place this drop of water on a piece of notebook paper instead of the wax paper, it would make a complete difference. The wax on the wax paper is what helps the water drop hold its shape because the wax is a hydrophobic surface. If the water was on notebook paper, the drop would just absorb into the paper instead of sitting on top of it. The results of this experiment were not what I hypothesized because the toothpick did not separate the drop, but it drug the drop across the paper.

Wax paper

In the third experiment, we were testing ways to get water from one beaker to travel down a sting and end up in another beaker.  I hypothesized that we could just start pouring the water onto the string and that it would just begin to go down it into the other beaker. So I tried to do this with a string about a foot and a half long. I quickly found out that this was not going to work. The water did not travel down the string what-so-ever. I had to think of ways that I could get the water to actually stick to the string so it would travel on it. I got the idea to wet the string before pouring the water on it. This helped tremendously. The water was actually making it to the other beaker. So I decided to try it with a longer string. The same procedure worked on a string approximately four feet long, and on another about six feet long. I tried the experiment on a string about ten feet long, but couldn’t get it to work. So the longest string that I could get the water to travel down was about six feet in length. This experiment was an example of the adhesion property of water, and could also be an example of cohesion. Adhesion is what makes the water stick to another substance. Because the string was wet, it was helping the water stick to the string. When the string was not wet, the water didn’t stick at all. So both of these properties contributed to the experiment by helping the water stick to itself and another substance.

Leave a comment »

Clinical Trials

This link will take you to the clinical trial that is chose to learn about.

1. What is the name of the study you chose? Double-Blind Placebo-Controlled Study of Acamprosate in Autism

2. Describe the purpose of the study. To test the theory that the drug Acamprosate will reduce the social skill deficits (inattention, hyperactivity, and irritability) that are associated with patients with autism spectrum disorder (ASD).

3. Describe the protocol that will be followed. What treatment is being investigated and how is it administered? What are the controls? What is the duration of the study and how will the results be determined? The treatment being investigated is the treatment of the social skill deficits found in patients with ASD by using the drug Acamprosate. Each patient with ASD will get 10 weeks of blinded treatment with either a placebo or acamprosate. The patients who are randomly placed on the placebo and are placebo non-responders (don’t show significant improvement) will then be invited to get 10 weeks of acamprosate. The patients who respond to acamprosate will then be able to enter Phase II. The control group is the group that received the placebo. Patients that weigh more than 50kg will receive a maximum dose acamprosate of 1998mg per day and those patients who weigh less than 50kg will receive 1332mg per day. The study began in April 2013 and is estimated to end February 2016.

4. This is a double-blind trial. Explain what that means for the patients and the personnel carrying out the study. This means that neither the personnel nor the patients know which is the placebo or the drug. The double-blind placebo is used to remove biased opinions.

5. Who is eligible to participate in the study? Both males and females, must be ages 5 to 17, diagnosed with ASD, in general good health, use of up to two concomitant psychotropic drugs, have stable seizure disorder meaning that they haven’t had a seizure in the last six months, have a Clinical Global Impression Scale Severity score of 4, and have a score of 13 on the Social Withdrawal subscale of the Aberrant Behavior Checklist.

6. To conclude your blog post, compare and contrast experiments with humans and experiments with other organisms. When testing on humans, most of the time the scientists are testing a drug or medicine. When testing on other organisms, scientists test things like drugs or other things, in the case of the experiment we did this past week, they tested bug infestations. Humans can choose whether or not they want to be experimented on, while other organisms can’t. When you test drugs on humans, sometimes it is their brain that heals them instead of medicine. If they think that they are given the medicine but they really are taking the placebo, they may still get better because their mind tells them they will. When you are testing a plant, you don’t have to worry about it responding to the placebo.

Leave a comment »

How Science Works and My Experiment

This week I read this article, which gave me a lot of information on the scientific method and how science actually works. I then designed my own experiment testing corn yield using a virtual lab.

Ever since I began learning science, I have been taught the same scientific method. First, you ask a question, then you come up with your hypothesis. Next, you test your hypothesis in an experiment and collect the information. Finally, you make your conclusion. Until I read this article, I didn’t realize that you don’t necessarily have to follow this exact process. I found out this process is actually too simplified, which isn’t how science actually works. You may have to do a different process for each experiment you do, and you may have to repeat steps over and over. You also have to interact with others in the scientific community. Scientific experiments can also be creative, and each can be different. I also learned that your experiment is pretty much ongoing and you can almost always update your information by asking more questions.

In the experiment I designed, I wanted to see how the different levels of the European Corn Borer (ECB) effects the yield of the genetically-engineered Bacillus Thuringiensis (BT) corn. I hypothesized that the yield would drop about ten kernels from when there was no infestation to a low infestation, and then about another ten kernels from a low infestation to a high infestation. The ECB level was the independent variable and the yield of the corn was my dependent variable. The controls of this experiment include the corn that had no ECB infestation, amount of light, type of soil, nutrient conditions, and amount of water the plants got. I chose to experiment on the BT 456 corn. I first tested the corn with no ECB level to see the average yield when there is no infestation. The yield average was 186. Then, I tested the same type of corn with a low level infestation. The average dropped to 177. I then expected the yield of kernels to drop about by about ten when I tested the corn with a high infestation level. I was surprised when the average for the high infestation level was 157.8, which was about double of what I thought. I thought that the genetically-engineered corn would be more resistant to the high infestation level than it was. So the results presented more of a drop than I hypothesized, showing me that the ECB infestation still has quite an effect on the BT 456 corn.

Corn Lab

Leave a comment »